Dashboard Overview
The Matomo Dashboard is the central hub for accessing and analyzing data related to the performance of Army MWR websites. It provides a comprehensive view of key metrics and user behaviors, enabling users to track website activity. This section provides an overview of the main features and functionalities available in the Matomo Dashboard.
Instructions
The Matomo Dashboard is organized into several sections, each designed to provide different types of information and analytics tools. Below is an overview of the key components:

Top Navigation Bar

The Top Navigation Bar in the Matomo Dashboard provides essential tools for navigating through reports, adjusting the date range, applying segments, and managing accounts, allowing users to customize their analytics view and quickly access key data.
Search box
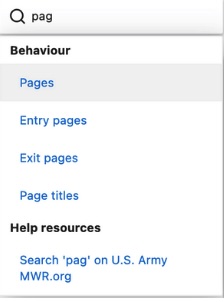
Search for instant answers to your questions, find reports, page titles, and insights.
Date Picker
- Adjust the date range. You can adjust the date range using the dropdown.
- Check the Compare to box to compare the previous period, year over year, or pick the dates.
Date Comparisons

Account Chooser

Account Chooser
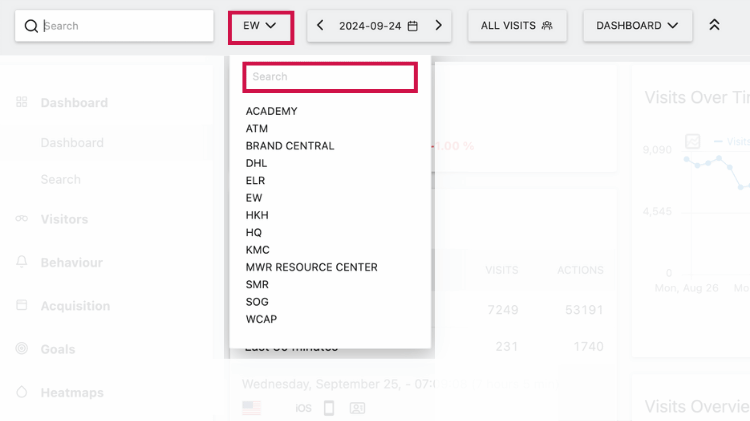
Switch between accounts a menu you can use to switch between all of the Analytics accounts and properties for which you have permission.
Segments
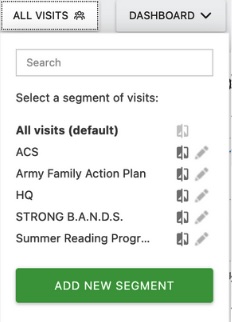
A segment in Matomo is a powerful tool that allows you to filter and analyze a specific subset of your data based on defined criteria, such as user behavior, demographics, or traffic sources.
Segments
Sidebar Navigation
On the left-hand side of the Matomo interface is your primary method for navigating through your data.
- Offers a structured menu for navigating between various reports and features, including Visitor Reports, Behavior, Acquisition, and Goals. Main Dashboard Area
- Displays customizable widgets that show key metrics such as total visits, page views, average session duration, and bounce rate.
- Allows users to add, remove, and rearrange widgets based on their preferences and needs.

By leveraging the Main Dashboard and its charting capabilities, you can easily identify performance trends, detect anomalies, and gain actionable insights to optimize your website’s performance.


