Exporting Reports
Exporting reports in Matomo allows you to share valuable data insights with your team or stakeholders in various formats. This guide will help you understand how to export reports effectively and customize them to suit your needs.
How to Export Reports
Exporting Reports in PDF, Excel, and Image Screenshots
- Navigate to the Report: Go to the Matomo dashboard and select the report you want to export. This can be any report, such as Visits, Goals, or Custom Reports.
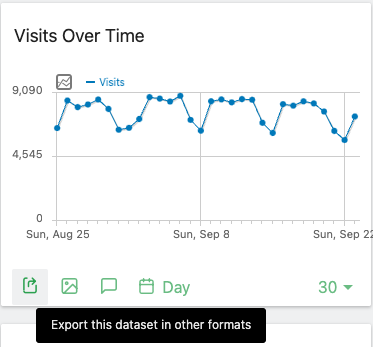
- Click the Export Icon: Locate the export icon in the lower-left corner of the report. Click on this icon to open the export options.
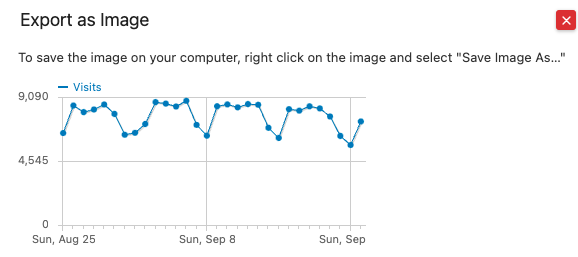
- Or Click the Image Icon: Locate the export icon in the lower-left corner of the report. Click on this icon to export the image.
- Choose Your Format: Select your desired export format from the dropdown menu.
 Available formats include:
- PDF: Ideal for sharing visual representations of the report with charts and graphs.
- Excel (XLSX): Useful for detailed data analysis or when you need to perform further calculations.
- CSV: Best for raw data export, allowing you to use the data in various applications or databases.

- Download the File: Once you've selected the format, click export. You can then open, save, or share the file as needed.
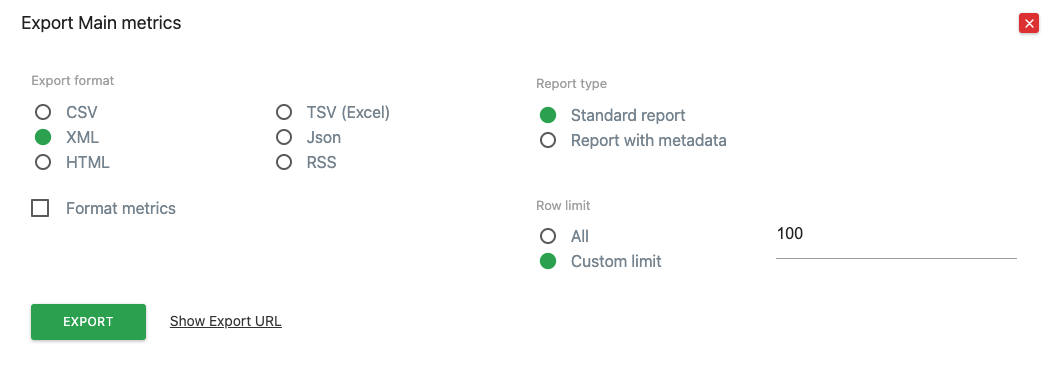
Export Format Details
CSV (Comma Separated Values)
Exports the report data in a simple text format where each value is separated by a comma. Useful for importing data into spreadsheet software like Excel or Google Sheets.
XML (Extensible Markup Language)
Exports the data in an XML format, which is structured and can be used for data exchange between different systems and applications.
HTML (HyperText Markup Language)
Exports the report in an HTML format, making it viewable in web browsers. This format preserves the visual layout and can be used for easy sharing or embedding in web pages.
TSV (Tab Separated Values) (Excel)
Exports data similar to CSV, but with tabs as separators instead of commas. This is particularly useful for Excel imports, as it handles data containing commas more gracefully.
JSON (JavaScript Object Notation)
Exports the data in JSON format, which is lightweight and easy to read. Ideal for web development and data integration tasks where structured data is needed.
RSS (Really Simple Syndication)
Exports data in RSS feed format, useful for automating data feeds or for integration with other applications that support RSS.
Report Type
Standard Report
Exports the basic data from the selected report, including key metrics like visits, page views, and bounce rate. This is the most common type of export for general reporting.
Report with Metadata
Includes additional metadata along with the standard report data, such as information about each column and more detailed context about the data. Useful when you need more insights into the structure and meaning of the data.
Row Limit
All
Exports all rows of data available in the report, regardless of the number of rows. This option is ideal when you need the complete dataset for in-depth analysis.
Custom Limit
Allows you to specify a custom number of rows to export. Enter the desired row limit in the text box (e.g., 100). This option is useful when you want to export a specific portion of the data, such as the top 100 rows.
Additional Options
Format Metrics
If checked, this option formats the metrics in the export file to include symbols (e.g., %, $, etc.) and human-readable values. If unchecked, metrics will be exported as raw numbers, which is ideal for further data processing.
Show Export URL
This option generates a direct URL that you can use to access the export with the same settings. It’s useful for automating report generation or sharing a specific export configuration with others.
Export Button
Click this button to generate and download the report based on your selected options.
Close Button (Red "X")
Click this button to close the export dialog without making any changes or exporting data.
Exporting reports in Matomo allows you to share valuable data insights with your team or stakeholders in various formats. This guide will help you understand how to export reports effectively and customize them to suit your needs.
Exporting reports in Matomo allows you to share valuable data insights with your team or stakeholders in various formats. This guide will help you understand how to export reports effectively and customize them to suit your needs.


