Visitor Reports
The Matomo Dashboard consists of several key sections that provide comprehensive insights into your website’s performance. Each section offers a variety of tools and reports to help you understand visitor behavior, track marketing efforts, and measure success. Below is an outline of these sections and what they offer.
Visitors
The Visitors section provides a detailed view of the traffic and behavior of visitors on your website. It includes multiple sub-reports that help you analyze visitor interactions and trends.
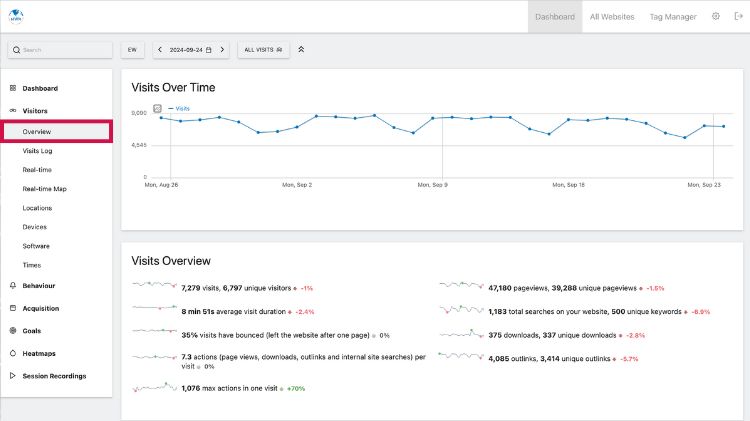
Overview
- Description: Provides a high-level summary of visitor statistics on your website.
- Key Metrics: Includes total visits, unique visitors, average visit duration, bounce rate, and more.
- Visualization: Displays trends and patterns over time with graphs and charts, helping to identify peak periods of activity and general traffic trends.
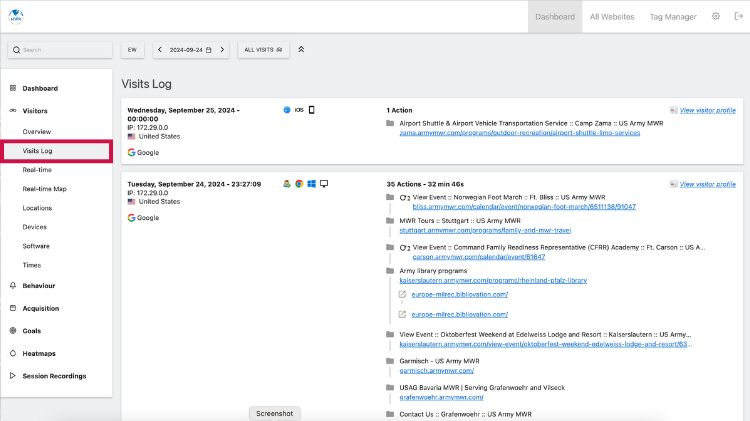
Visits Log
- Description: Displays a comprehensive log of individual visits, showing detailed information about each visitor's interaction with the website.
- Data Included: Visit time, visited pages, time spent on each page, referrer source, and user actions (e.g., clicks, downloads).
- Use Case: Useful for understanding specific user behavior and tracking how visitors navigate through the website.
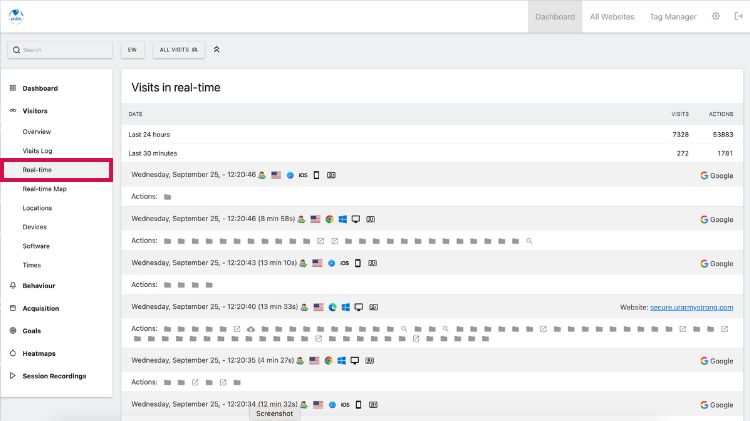
Real-time
- Description: Shows current activity on the website in real-time.
- Data Included: Active users, pages being viewed, and actions being taken at any given moment.
- Use Case: Useful for monitoring live traffic, especially during marketing campaigns or events.
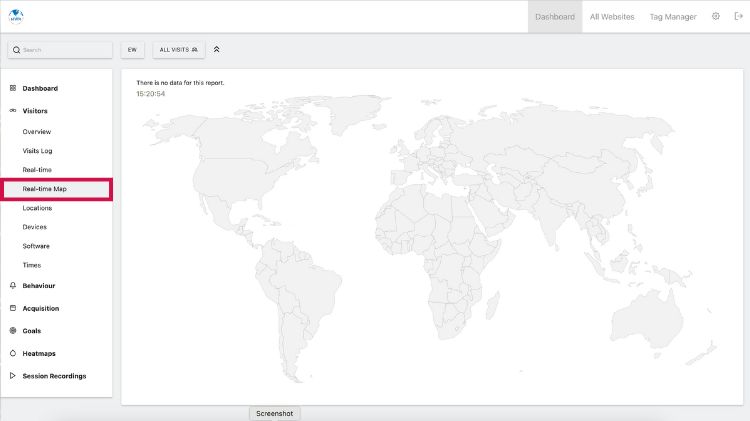
*Real-time Map
- Description: Provides a geographical visualization of where your visitors are currently located.
- Data Included: Real-time data on a world map, including the number of visitors and their locations.
- Use Case: Helps identify global reach and monitor region-specific traffic patterns.
*Available if there is enough traffic
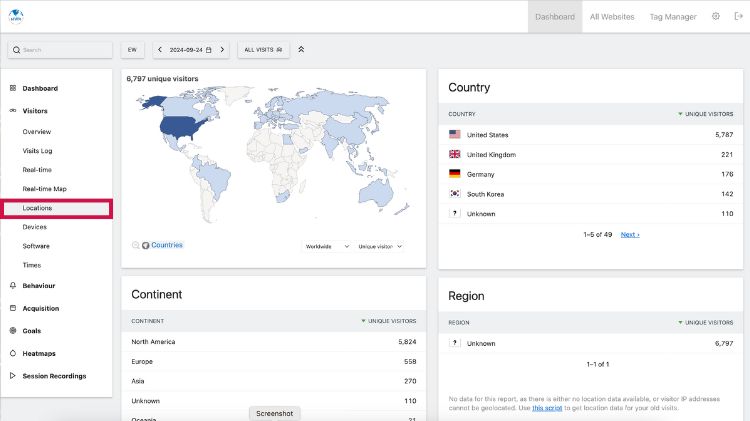
Locations
- Description: Details the geographical distribution of your visitors.
- Data Included: Information on countries, regions, and cities from which the website is accessed.
- Use Case: Assists in understanding where your audience is coming from and in tailoring content or marketing efforts to specific regions.

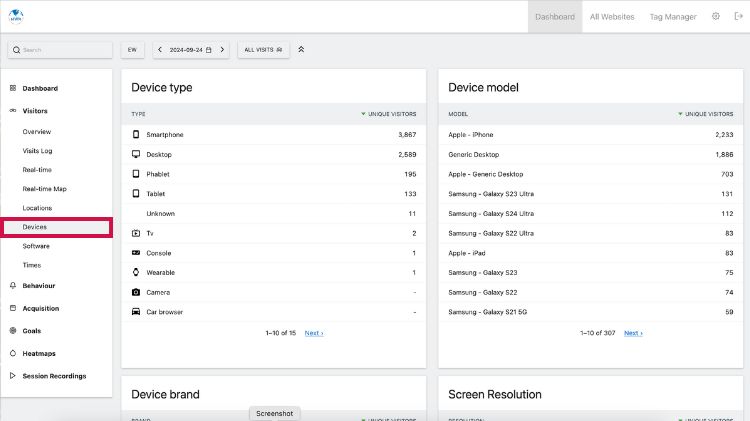
Devices
- Description: Breaks down the types of devices used to access your website (e.g., desktops, smartphones, tablets).
- Data Included: Insights into device models, brands, and operating systems.
- Use Case: Useful for optimizing your website's design and functionality for the most commonly used devices.
Software
- Description: Displays the software and browser information used by visitors, such as browser types, versions, and operating systems.
- Use Case: Helps ensure compatibility and identify potential issues users might face based on their software environment.
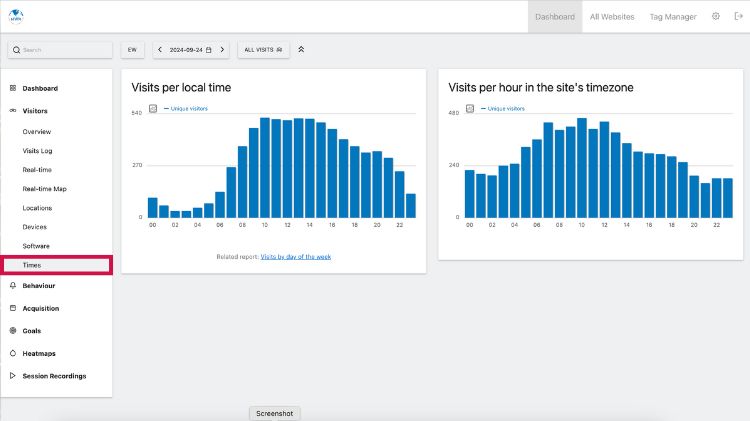
Times
- Description: Shows the times of day and days of the week when your website receives the most traffic.
- Use Case: Useful for scheduling content updates, marketing campaigns, and understanding visitor behavior patterns.
Whether you’re new to Matomo or looking to enhance your analytics skills, this tutorial will help you leverage Matomo’s powerful reports to gain deeper insights and make data-driven decisions for your website